Case Study: How Immigration Enforcement Operations Triggered a Historic School Attendance Collapse in Charlotte-Mecklenburg

Overview
On November 17, 2025, Charlotte-Mecklenburg Schools (CMS) experienced one of the largest single-day attendance drops in district history—over 21,000 students absent. Using Orbit by Virlo, we analyzed 185 videos across TikTok, Instagram, and YouTube to understand how immigration enforcement events, community anxiety, and social media amplification combined to create a district-wide educational disruption.
This case study breaks down the data behind the viral moment: what drove the engagement, how narratives formed, and what it reveals about how quickly real-world events cascade through short-form platforms.
1. The Spark: Operation “Charlotte’s Web” Dominates Social Platforms
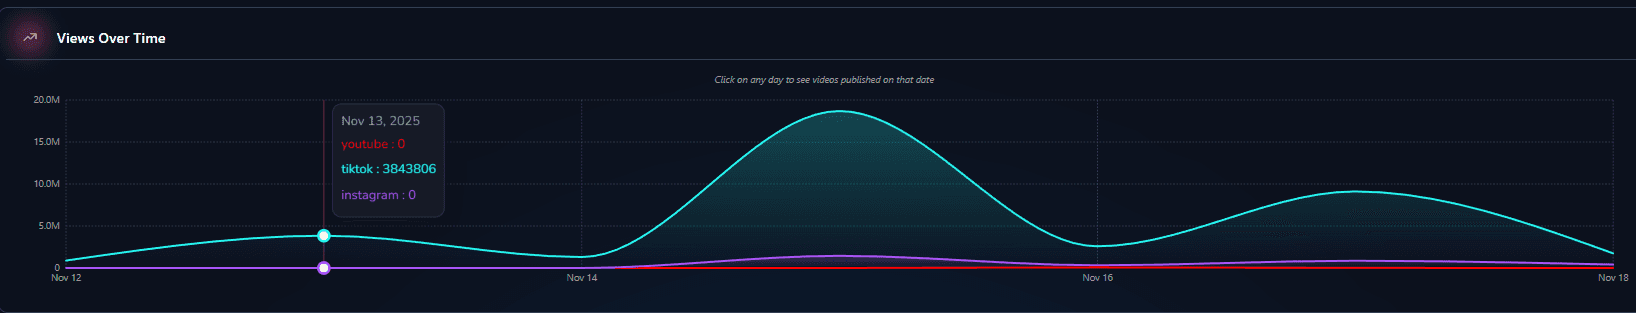
Immigration enforcement activity across Charlotte triggered a wave of documentation and commentary online. Operation “Charlotte’s Web” generated 13.2M+ total views, making it the top-trending immigration enforcement story in the U.S. during the week of November 12–18.
The defining moment—a grocery store arrest video posted by The Charlotte Observer—surged past 3.7M views in 72 hours, becoming the most-watched Border Patrol-related TikTok of the year.
Why It Mattered
Enforcement clips consistently outperformed government statements.
Citizen-documented videos averaged 156K views, nearly double the engagement of official reporting.
The public narrative centered on perceived mismatches between “criminal targeting” promises and the arrests shown online.
2. School Attendance Crisis: Fear Overrides Education
The school system became ground zero for the community response. According to Orbit’s dataset, education-related content reached 847,000 collective views, with student-generated posts far outpacing official CMS communication.
Key Educational Impacts
21,000+ student absences across CMS on Nov. 17 (15% drop).
District messaging received 42,669 views, while student posts reached 5–7x higher engagement.
Families publicly reported keeping children home due to fear, uncertainty, and reports of enforcement near bus stops and grocery stores.
Student activism also exploded:
Walkouts surged 400% compared to standard school protest activity.
East Mecklenburg High School’s video hit 293,646 views.
Olympic High’s protest generated 150,025 views.
3. Community Fear & Solidarity Fueled Viral Spread
Local businesses and community hubs responded in ways that accelerated the narrative online.
Manolo’s Bakery: From Local Staple to Viral Symbol
After 28 years of uninterrupted operation, Manolo’s Bakery closed its doors during the enforcement period. Closure videos and solidarity posts generated 714,517 combined views, making the bakery an unexpected focal point of community support.
Grassroots Mobilization
Orbit surfaced a rapid formation of:
Parent-run school watch groups
Neighborhood alert networks
Church-led organization efforts
These “community protection” videos averaged 127,000 views, outperforming national news coverage.
TikTok became the dominant platform for these narratives, capturing 78.4% of all videos and driving the highest engagement.
4. Creator & Media Influence: Who Drove the Conversation?
Top Performers
@thecharlotteobserver: 7.1M total views across 4 videos
Micro-creators (<50k followers): 31% of total viewership
Teachers and counselors: 3x engagement compared to district accounts
Verified accounts accounted for 67% of total views, but unverified local creators achieved double the engagement rate, demonstrating trust in on-the-ground perspectives.
Youth-Led Virality
High school creators achieved view counts normally reserved for major influencers. Orbit identified youth activism as one of the strongest engagement drivers during the entire enforcement event.
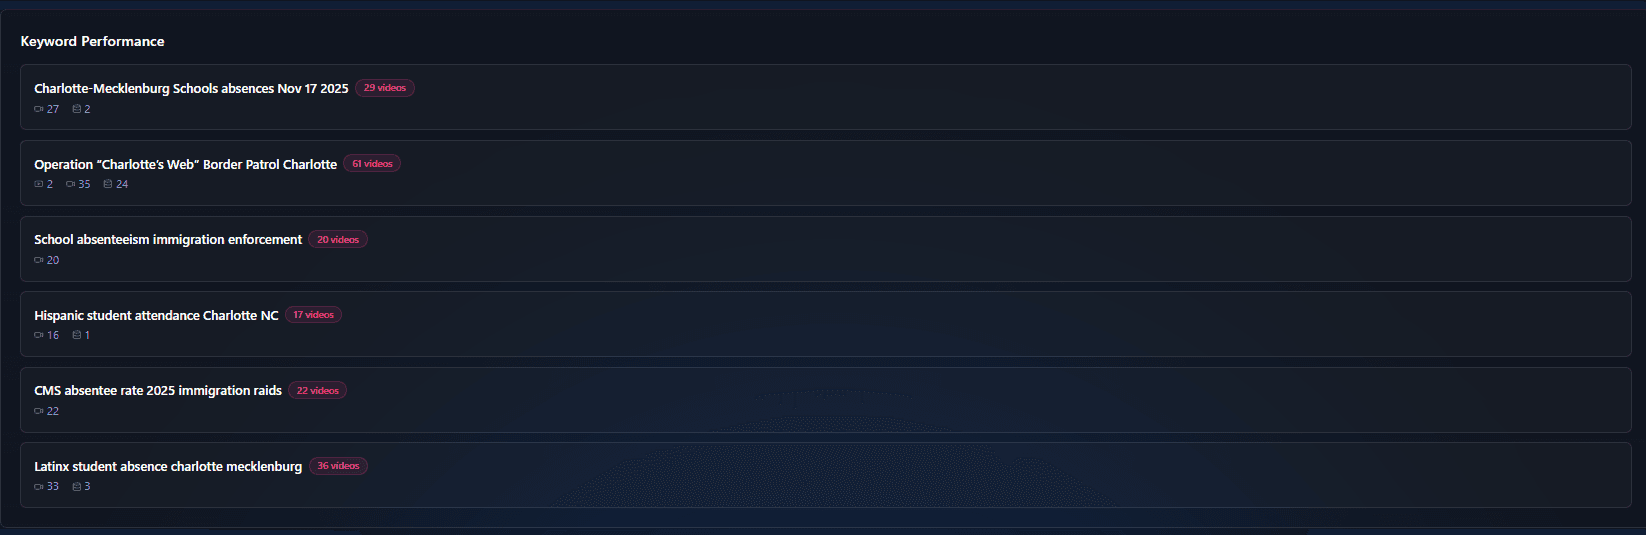
5. Hashtags, Topics & Sentiment Trends
Orbit’s topic clustering uncovered distinct conversation ecosystems tied to school safety, civil rights, and community security.
Top Hashtags
#charlotte — 8.2M views
#charlottenc — 6.1M views
#ice — 4.3M views
#borderpatrol — 2.8M views (breakout tag)
Education-specific tags like #cms, #cmsparents, and #teachersoftiktok formed a separate cluster with 1.4M combined views.
Sentiment Breakdown
68% critical/concerned (highest engagement: 312K avg. views)
18% supportive of enforcement (89K avg. views)
14% neutral news coverage
Fear-centered narratives performed 4x better than supportive content, driven largely by real-world community impact.
6. Viral Outliers & Patterns
Orbit surfaced several outlier insights:
The grocery store arrest clip performed 1,200% above the creator’s average.
Monday content dramatically outperformed weekend content (3x higher views).
Videos featuring multiple generations—parents, students, and community leaders—saw 89% higher engagement.
Student videos repeatedly exceeded algorithmic norms, signaling a strong platform preference for youth-led reporting during high-stakes events.
Conclusion: What This Event Reveals About Real-Time Social Data
The Charlotte-Mecklenburg absentee spike shows how quickly local events can escalate into national conversations when amplified through short-form platforms. Community fear, student activism, and real-time mobile documentation created a feedback loop that reached millions within days.
Orbit by Virlo helped uncover the mechanics behind that virality—clarifying what people saw, how they reacted, who drove the conversation, and how the narrative shifted as the situation evolved.
For brands, institutions, and public-sector organizations, this case illustrates the importance of:
Monitoring real-time local sentiment
Identifying narrative drivers early
Understanding how grassroots content shapes public perception
Responding on platforms where community voices dominate
To analyze your own brand, location, policy issue, or crisis moment, explore Orbit by Virlo at virlo.com.
See What's Trending Right Now
- Social listening for TikTok, Reels & Shorts
- Spot viral trends before they peak
- Turn insights into ads, scripts & briefs
The Signal Newsletter
Weekly trend breakdowns, creator insights, and social listening tips — straight to your inbox.
Subscribe FreeSee What's Trending Right Now
- Social listening for TikTok, Reels & Shorts
- Spot viral trends before they peak
- Turn insights into ads, scripts & briefs
The Signal Newsletter
Weekly trend breakdowns, creator insights, and social listening tips — straight to your inbox.
Subscribe FreeRelated Articles

Case Study: How Orbit Turns Narrative Into Measurable Insight
This post showcases a real experiment using Virlo’s Content Studio to demonstrate the impact of Orbit data on content creation. The same blog prompt was run twice to show the difference in data between the two, and the impact it can have.

How 38-0-0 Went Viral on a $0 Budget: the Short-Form Play Behind a #1 App
A 24-year-old who cannot code built a #1 App Store game in a weekend for under $50, beating studios that spend millions. Here is the real story, why it actually went viral, and the exact short-form play you can run.
How Comfrt Grew Into the #1 Hoodie on TikTok (and Hit $500M in Under 3 Years)
Comfrt launched in 2022 with $50,000 and three hoodie colors. Under three years later it's the #1 apparel brand on TikTok Shop with $500M+ in revenue. Here's the playbook, and how to run it without a decade of relationships.
Get The Signal
Join creators, marketers, and agencies getting weekly trend breakdowns and social listening insights delivered free.
Subscribe to the Newsletter
Stop Guessing. Start Knowing.
Join thousands of digital entrepreneurs using data to take the guesswork out of capitalizing on trends.