Master Social Media Impressions For Maximum Reach
Learn how to measure and boost social media impressions with data-driven tactics, platform insights, and real-world Virlo examples.


Every time someone’s scroll brings your post onto their screen, that’s an impression. It doesn’t matter if they pause, tap, or scroll right past—your brand still had its moment. Visualize these as digital billboards briefly lighting up a user’s feed, and you’ve got the essence of impressions.
Tracking impressions gives you a clear gauge of how often you appear before eyes, laying the groundwork for deeper metric analysis.
How Impressions Shape Visibility
Impressions count each instance your content loads on a timeline, not just first encounters. So if one curious user circles back to your post three times, that counts as three impressions.
Impressions focus purely on visibility—every load counts.
Reach tallies unique users who saw your content at least once.
Engagement sums likes, comments, shares, and other interactions.
Views register when a video actually plays, signaling active interest.
Here’s a concept map visualizing how impressions, reach, and engagement interconnect on social platforms.
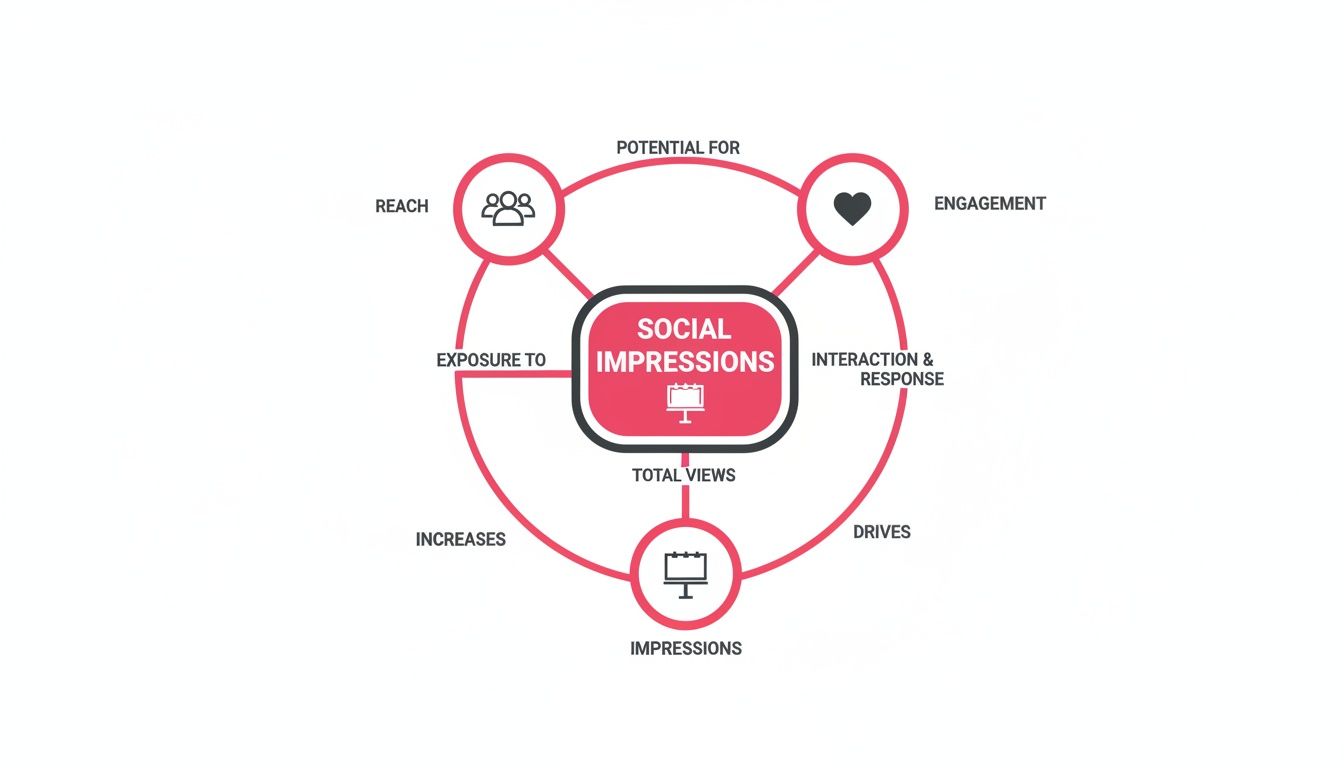
This diagram shows how impressions spark initial awareness, while reach and engagement map out audience breadth and depth.
Comparing Impressions Reach And Engagement
Let’s break down these metrics side by side to see what they represent and exactly how they’re calculated.
Metric | Definition | Calculation Method |
|---|---|---|
Impressions | Total times content appears on screen | Count every load or scroll event |
Reach | Unique users who saw a post | Count distinct user identifiers |
Engagement | Interactions like likes, comments, shares | Sum of all engagement actions |
Understanding these distinctions is key to interpreting your analytics and planning next steps effectively.
Counting Methods Across Platforms
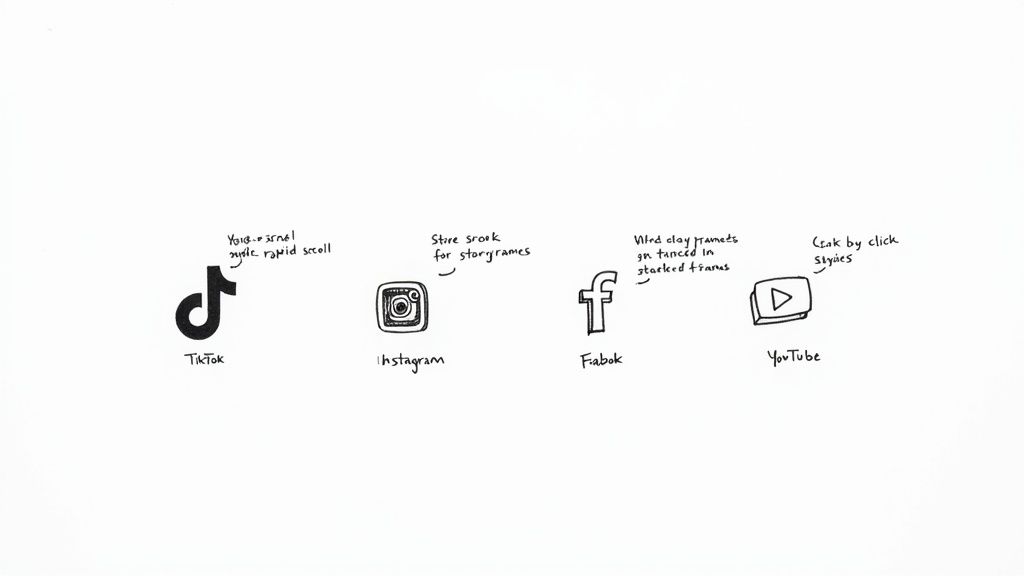
Platforms each have their own counting quirks. For instance, Instagram Stories logs every frame view, while TikTok treats rapid scrolls as new impressions.
With 5.42 billion users across social networks and each person juggling 6.83 different platforms monthly, feeds are more crowded than ever. Dive into Sprout Social's social media statistics report for full context.
Insight: High impressions alone don’t guarantee engagement, but they ensure your message hits the window of attention.
Check out our guide on social media analytics tools to compare platforms and boost your visibility.
Each network’s algorithm defines its own rules for what counts as an impression. Instagram, Twitter, TikTok—it’s all different. Before you budget time or ad spend, peek at each platform’s help center to see how they log views.
Knowing these nuances stops you from misreading your data and helps you choose the channels that deliver the highest visibility. Master your impression metrics today, and you’ll build a solid foundation for optimizing both reach and engagement in the long run.
Platform Specific Impression Counting
Each social network tallies impressions by its own playbook. Before you line up numbers side by side, it’s worth knowing what each platform actually measures.
TikTok counts a new impression with every rapid swipe—even if the clip never finishes loading.
Instagram Stories treats every second of playback as a distinct view.
Facebook kicks off its impression counter at the one-second mark on auto-playing videos.
Platforms like X require a tap to start, so impressions only log once the viewer clicks to play.
TikTok Impression Mechanics
On TikTok, each scroll event resets the counter. That means a fast thumb swipe can create impressions faster than someone can say “next.”
For instance, if a viewer flicks past two videos in five seconds, TikTok records two impressions—even if neither video played to the end.
Key Insight High-speed scrolling on TikTok often inflates impression counts well beyond genuine attention.
Use Virlo’s trend analysis to spot peak scroll periods.
Schedule your most eye-catching posts around those high-scroll moments.
Compare TikTok impressions side by side with YouTube Shorts right in Virlo dashboards.
Instagram Story Counts
Instagram slices a 15-second Story into 15 separate impressions—one for each second a viewer watches. It’s like counting each frame in a flipbook.
This method can send your Story numbers soaring, but it doesn’t always reflect unique views.
Rotate core messages throughout multi-part sequences.
Mix Story posts with feed or Reel content for balanced reach.
Keep an eye on drop-off rates to understand when viewers lose interest.
Facebook Video Impressions
On Facebook, auto-playing videos get stamped at the one-second mark. Click-to-play clips, however, only log impressions when someone taps to watch.
These differences matter when you’re planning organic posts versus paid ads.
Test auto-play videos for broad awareness objectives.
Experiment with click-to-play formats to drive deeper engagement.
Bring both data sets into Virlo to see which style moves the needle.
Check out our guide on TikTok Creator Analytics in our article for deeper analysis of impression behavior.
Mastering these platform-specific quirks means smarter content and budget decisions. Use Virlo to normalize impressions across TikTok, Instagram, and Facebook, so your next campaign hits the ground running.
Common Misconceptions And How To Avoid Them
At first glance, it’s tempting to treat impressions like a scoreboard—the higher the number, the better the performance. But it’s more like counting cars on a highway: you know they passed by, not whether they stopped at your shop.
When brands chase raw figures without tying them to engagement or ROI, they risk confusing noise with signal. After all, a video with 2 million views might only bring in a handful of clicks.
To sidestep this trap, watch out for five common missteps—and grab a practical fix for each:
Trap 1: Assuming High Impressions Guarantee High ROI
Trap 2: Believing Impressions Equal Audience Interest
Trap 3: Misreading Bot Or Low-Quality Traffic
Trap 4: Ignoring Context And Impression Quality
Trap 5: Failing To Align Counts With Goals
These pitfalls can scatter your budget and leave campaigns drifting. Let’s refocus on meaningful interactions.
Quality Over Quantity
Organic reach has quietly cratered: Instagram now averages 3.50% and Facebook 1.65%, both down 12% year-over-year. Dive into the organic reach drops to see why paid impressions are surging.
Instead of chasing big numbers, plug your data into Virlo and pan out the fluff. Think of it as gold panning—you want the nuggets, not every speck of sand.
Insight Not all impressions hold equal value. High-quality exposures often drive more clicks than raw volume.
Bots and low-value traffic can send your metrics off-road. Use Virlo’s filters to block suspicious spikes and zero in on genuine touchpoints.
Next, anchor each impression to a clear goal—like sign-ups or video watches:
Track conversion rates alongside impressions to measure ROI
Spot upward trends in Virlo dashboards and tweak your creative on the fly
Set minimum engagement thresholds before amplifying content
By clearing these myths and applying data-backed tactics, you’ll stop wasting resources and start crafting campaigns that truly resonate.
Consider this real-world example: one creator amassed 5 million impressions on a dance clip yet saw just 0.02% click-through. With Virlo, they pinpointed high-engagement niches and reallocated ad spend to viewers who’d interacted with similar content before.
Make a habit of scanning your Virlo dashboards for emerging patterns. Shift your content calendar toward the impressions that matter. This ongoing fine-tuning keeps you from chasing hollow metrics.
Benchmarking Industry Impression Standards
Setting realistic targets for social media impressions starts with solid benchmarks across each channel.
Brands tie their budgets directly to visibility, so knowing where your dollars go—and how far they stretch—is essential.
Global social media ad spend has swelled to $276.7 billion, claiming 30% of all digital ad dollars and sending an enormous wave of impressions across networks. Read the full research on Dreamgrow.
To see how platforms compare, consider these monthly reach figures and spend shares:
YouTube ads often reach 1.9 billion users each month while accounting for 15% of global spend.
Instagram ads tap into 1.4 billion active accounts with 20% of the ad budget.
TikTok ads reach 1.2 billion viewers and command 10% of total spend.
Facebook leads with 2.3 billion monthly users, absorbing 25% of ad dollars.
This snapshot shows where each platform drives impressions most cost-effectively.
Ad Reach And Spend
The following table illustrates each platform’s monthly ad reach alongside its share of global ad spending.
Platform | Monthly Ad Reach | Global Ad Spend % |
|---|---|---|
2.3 billion | 25% | |
1.4 billion | 20% | |
YouTube | 1.9 billion | 15% |
TikTok | 1.2 billion | 10% |
This breakdown helps you see at a glance where your ad dollars make the biggest impact.
Use Virlo dashboards to track real-time shifts in spend efficiency and spot emerging channels instantly.
Insights For Your Budget
Every industry delivers different impressions per dollar spent. Retail brands often score around 2,500 impressions per dollar, while finance averages closer to 1,200.
For instance, one fashion retailer shifted budget toward Instagram Reels and achieved a 30% lift in impressions per dollar in just four weeks.
Insight: Retail efficiency makes sense given fast-moving products and strong consumer interest in deals.
To optimize your spend:
Benchmark against your top three competitors using Virlo’s Compare feature.
Allocate extra budget to platforms delivering the highest impressions per dollar.
Monitor your dashboards weekly to catch algorithm tweaks or seasonal shifts.
Understanding these standards means you can hit visibility milestones without blowing your budget.
Spotting Top Performing Industries
With Virlo’s Niche Library, you can see which sectors excel at impressions per dollar on short-form platforms:
Dairy brands often harness humor and memes to pull in 3,000 impressions per dollar.
Tech startups sharing quick how-tos average roughly 1,800.
Expert Insight: Cross-industry comparison reveals that entertainment-style content consistently ranks high for spend efficiency.
Tailor your creative to mirror these high-performing formats and sharpen your messaging for even better results.
Next, refine your mix of organic and paid strategies to boost social media impressions and ROI.
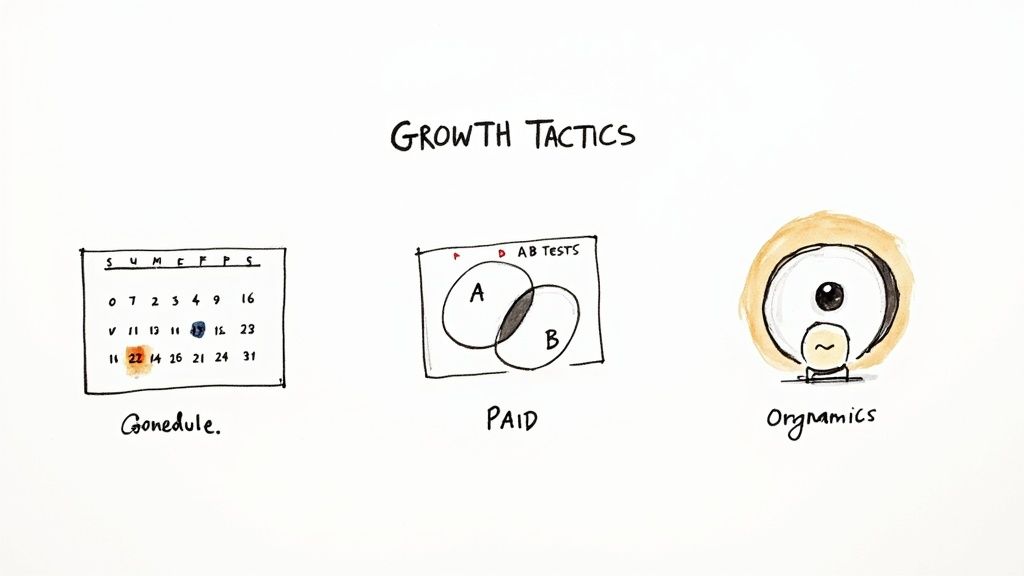
Tactics To Grow Social Media Impressions
Every leap in impressions is built on deliberate, repeatable moves. Mix data-driven insights with bold creative tests, and you can grow your visibility on demand.
Use Virlo dashboards to catch rising topics before everyone else
Craft visuals so compelling they demand a double-tap
Post when your audience is most active and scrolling fast
Pair paid boosts with organic traction for a multiplier effect
A/B test hooks and captions to pinpoint what really works
Spot Trends With Virlo
Imagine scanning 20,000 creators daily and zeroing in on hot niches before they spike. That’s what Virlo’s trend dashboard does—it flags emerging hashtags and topics ahead of the crowd.
To illustrate, here’s a dashboard view tracking rising hashtags.
You’ll see trends ranked by growth and freshness, including a 35% week-over-week jump in a niche tag. It’s your signal to craft content around that window.
Set alerts for the top 5 fastest-rising tags
Bookmark standout examples from creators you admire
Export CSVs to slot fresh topics into your content calendar
A simple update to your editorial plan keeps your feed lively and on message. Plus, Virlo filters let you narrow by region, length, or engagement rate—so you chase trends that match your brand voice.
Optimize Visual Hooks
You have milliseconds to grab someone’s attention. The right thumbnail or opening frame can lift impressions by up to 45% when it taps into a trend cue.
Run quick 12-hour tests using both static images and brief video previews. You’ll learn fast what resonates and what falls flat.
Here’s a straightforward A/B testing process:
Create two versions of a 3-second opening clip
Publish both with the same caption and tags
Let them run for 24 hours and track impression gains
Pick the one with the highest view-to-impression ratio
Lean on Virlo’s creative library to adapt high-performing styles in your niche.
Use bold text overlays for instant clarity
Keep titles under 6 words for quick reads
Match thumbnail colors to trending palettes
“Small tweaks in color and pacing can deliver a 20% boost in impressions,” notes a top creator using Virlo.
Balance Paid And Organic
Your organic hits tell ad platforms which content to favor. When you promote those winners, reach skyrockets—and your CPM can improve by 25%.
Dip paid dollars into lookalike audiences and monitor early feedback closely. That way, you refine messages before scaling budgets.
Extend reach into lookalike audiences
Test paid creative on a small scale
Track cost-per-1,000-impressions (CPM) in Virlo
Watch comment sentiment for red or green flags
Adjust targeting based on engagement patterns
Reallocate budget toward top-performing creatives
Timing is crucial, too. Use social listening to spot peak chatter and schedule your boost then. Virlo’s automation tools can nudge you to post when engagement is prime.
Repeat this blend of tactics each week, and you’re on a clear path to steady growth.
Learn more about scaling your efforts in our article on advanced social media growth strategies: https://virlo.ai/blog/social-media-growth-strategies
Integrate these steps into your daily workflow, track results in Virlo every morning, and tweak in real time. Then sit back and watch those impressions climb.
Use historical view-through and click-through rates to refine your creatives
Set clear weekly impression growth targets to keep momentum going
Real Campaign Examples With Virlo
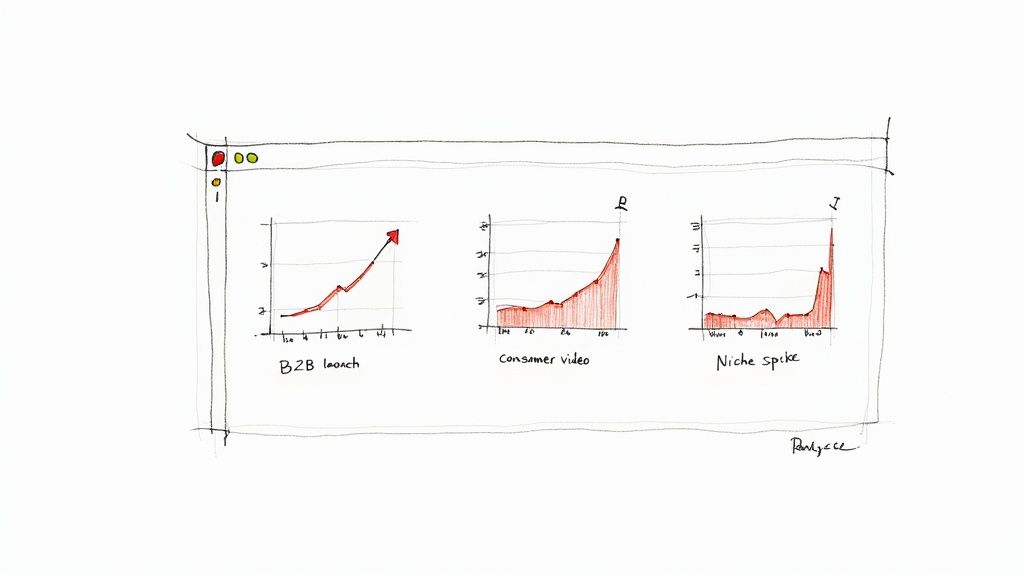
When data meets instinct, sparks fly. Here are three campaigns where Virlo went beyond dashboards—turning raw numbers into real wins.
In our first example, a niche B2B startup zoomed in on micro-influencers. Using Virlo’s follower-count filter, they discovered a tag racking up 1.2 million impressions in just 48 hours. An instant alert on that spike let the team amplify the post before competitors even noticed.
Next, a consumer brand leaned into a short-form challenge video. By lining up TikTok and YouTube Shorts impressions side by side, they spotted a simple format tweak that lifted reach by 35%. Before bedtime, impressions jumped from 250K to over 900K—all thanks to that one insight.
B2B Launch Tracking with Follower Filters — micro-influencers fueled early momentum
Cross-Platform Comparison — refine content between TikTok and YouTube Shorts
Real-Time Alerts — catch surges before the feed buries them
Tracking And Alerts
An e-commerce seller tapped Virlo’s analytics view to ride a product-launch buzz. Alerts flagged a 120% day-over-day jump linked to a trending sound. They adjusted the hook and thumbnail tag—and rode that wave to 2 million impressions.
Case Study Insights
These snapshots prove that impressions are more than vanity—they’re signals. By filtering for follower size or trending audio, you zero in on high-value moments. And a dashboard that highlights day-over-day change makes those sudden jumps impossible to miss.
Key Takeaway Real-time trend alerts can boost impressions by over 40% within hours.
Across all three cases, speed and context turned data into momentum. You can replicate this: set your filters, watch your alerts, and pounce on those spikes while attention is at its peak.
Social Media Impressions FAQ
Here’s a quick FAQ to help you decode common questions about social media impressions and take action with confidence.
Impression Counting Explained
What exactly counts as an impression on different platforms?
Let’s break it down:
TikTok counts each rapid swipe as a new impression.
Instagram Stories logs every frame view separately.
Facebook auto-play videos record an impression after 1 second of playback.
YouTube Shorts treats each playback as a single impression.
This simple snapshot reveals how platform rules shape your raw numbers and guide your next move.
Why do impressions matter if engagement is low?
Even a silent scroll past your video boosts your brand’s visibility. Over time, those passive views pave the way for stronger ad targeting and future interactions.
High impressions lay the groundwork for retargeting and lookalike campaigns, turning casual viewers into engaged followers.
Data Accuracy Checks
How can I verify my impression data is accurate?
Cross-check native analytics with third-party tools like Virlo.
Use time-stamped reports to spot unexpected spikes or gaps.
Filter out known bot activity by watching for high-frequency bursts.
A routine review prevents skewed insights and keeps your strategy honest.
Which Virlo Features Detect Bot-Driven Counts?
Virlo’s dashboard makes suspicious patterns stand out. On top of anomaly alerts, you’ll find:
De-duplicated Trend Ranking to strip out repeat impressions.
Engagement-Quality Filters that weed out low-value views.
Bot-Pattern Detection using rapid-fire event analysis.
These tools ensure your impression data reflects genuine audience behavior.
Refer back to the Platform Specific Impression Counting and Common Misconceptions sections for deeper context.
Can I Compare Impressions Across Platforms?
Absolutely. Virlo’s cross-platform compare view lines up TikTok, YouTube Shorts, Instagram, and Facebook impressions side by side. You’ll pinpoint where you’re winning—and where you need to double down.
Ready to turn impressions into impact? Try Virlo at https://virlo.ai and start spotting real trends today!
See What's Trending Right Now
- Social listening for TikTok, Reels & Shorts
- Spot viral trends before they peak
- Turn insights into ads, scripts & briefs
The Signal Newsletter
Weekly trend breakdowns, creator insights, and social listening tips — straight to your inbox.
Subscribe FreeSee Virlo in action
See What's Trending Right Now
- Social listening for TikTok, Reels & Shorts
- Spot viral trends before they peak
- Turn insights into ads, scripts & briefs
The Signal Newsletter
Weekly trend breakdowns, creator insights, and social listening tips — straight to your inbox.
Subscribe FreeGet The Signal
Join creators, marketers, and agencies getting weekly trend breakdowns and social listening insights delivered free.
Subscribe to the Newsletter
Stop Guessing. Start Knowing.
Join thousands of digital entrepreneurs using data to take the guesswork out of capitalizing on trends.