TikTok Creator Analytics Guide to Growth
Unlock your channel's potential with this complete guide to TikTok creator analytics. Learn to read metrics, understand your audience, and create viral content.


TikTok Creator Analytics is the platform's built-in dashboard that tells you everything you need to know about your account's performance, who your content is reaching, and the people watching it. In short, it’s the key to turning random posting into a focused growth strategy. Instead of just guessing what might work, you get to see exactly what connects with your audience.
Why TikTok Creator Analytics Matter for Growth
Think of your TikTok Creator Analytics as a compass for your content journey. Without it, you’re just sailing blind and hoping you stumble upon a viral hit. With it, you get a direct feedback loop from your audience, guiding every single decision you make and steering you toward real, sustainable growth.
The platform's scale is mind-boggling, making it an incredible space for creators. As of early this year, TikTok reported around 1.6 billion monthly active users, with people spending an average of 58 minutes on the app every single day. That's a massive opportunity.
To tap into that potential, you have to move beyond just guessing. Analytics is what replaces assumptions with certainty, showing you precisely what hooks viewers, what makes them hit rewatch, and when they’re most likely to be scrolling through their feeds.
From Guesswork to Strategy: Your Analytics Mindset Shift
Making the jump from posting content into the void to creating with purpose requires a mindset shift. It's about trading guesswork for a clear, data-backed strategy.
Creator Approach | Without Analytics (Guesswork) | With Analytics (Strategy) |
|---|---|---|
Content Ideas | "I think this funny sound will work." | "My audience loves my 'day in the life' videos; I'll do another." |
Posting Times | "I'll post whenever I finish editing." | "My followers are most active at 7 PM on Thursdays." |
Audience | "I'm trying to reach everyone." | "My core audience is women aged 18-24 in the US." |
Growth | "Why did that one video flop?" | "The last video had low watch time; I'll make the hook stronger." |
This table shows the difference plain as day. Analytics gives you the "why" behind your performance, allowing you to build on your wins and learn from your misses.
Unlocking Your Data Compass
Before you can dive into this goldmine of data, you need to make one simple tweak to your account. Personal accounts don't get analytics, so you’ll have to switch to either a Creator or Business account. Don't worry, it’s free and takes about thirty seconds.
Here’s why this is a non-negotiable step for any serious creator:
Make Smarter Decisions: Stop throwing content at the wall and hoping something sticks. Analytics helps you understand why a video took off so you can actually replicate that success.
Truly Know Your Audience: Find out who your followers really are—their locations, their gender breakdown, and when they’re most active. This lets you create content that speaks directly to them.
Work With the Algorithm: TikTok’s algorithm rewards content that keeps people on the app. By looking at metrics like watch time, you can optimize your videos to give the algorithm exactly what it wants.
Learning to read your TikTok data is what elevates your approach from a hobby to a genuine strategy. It’s the difference between just making videos and actually building a brand.
The process is simple: head to your profile settings, tap "Manage Account," and choose "Switch to Business Account" or "Switch to Creator Account." Once you flip the switch, TikTok will start collecting data on all your future videos.
For creators looking to seriously scale their presence, investing in the best TikTok tracker tools can also be a game-changer, offering deeper insights that go beyond what the native app provides.
Navigating Your Analytics Dashboard
Think of your TikTok analytics dashboard as your mission control. It’s where all the raw numbers and data points come together to tell a clear story about what’s working, what’s not, and who’s watching. It might seem intimidating at first, but it’s actually broken down into three simple tabs that answer the big questions about your account.
Getting there is easy. From your profile, just tap the three lines in the top-right corner, head into Creator Tools, and then tap on Analytics. This is where you’ll start making smarter, data-driven decisions instead of just guessing what your audience wants to see.
Let's walk through it.
This is the first thing you'll see—the 'Overview' tab. It's designed to give you a quick, high-level summary of your account's health.
Right away, you can spot trends for essential metrics like video views and your follower count, giving you an immediate gut check on your channel’s momentum.
The Overview Tab: Your Channel’s Vitals
The Overview tab is like your channel's real-time pulse check. It’s a snapshot of your account's most important vital signs over a period you can set to the last 7, 28, or 60 days. This should always be your first stop to get a sense of your overall trajectory.
You'll find the big-picture numbers here, including:
Video Views: The total number of times your videos were watched in that timeframe.
Profile Views: How many people were curious enough to click over to your profile page.
Follower Count: A clean graph showing your follower growth day by day.
Think of this tab as the headline news for your account. It tells you if you’re growing, stalling, or shrinking, which sets the stage for a deeper dive into why. A sudden spike in views here, for example, is a huge clue that one of your recent videos is starting to take off.
The Content Tab: Your Creative Report Card
Next up is the Content tab. This is basically a detailed report card for every single video you post. While the Overview tab shows you the forest, this section lets you inspect each individual tree. It’s where you’ll pinpoint your breakout hits and figure out exactly what creative choices are resonating with people.
This tab highlights your trending videos from the past seven days and lets you click into any post for a super granular breakdown. Digging into this data is the key to figuring out how to replicate your successes. For an even more advanced look, a powerful TikTok analyzer can reveal deeper patterns that you might miss in the native dashboard.
The Followers Tab: Your Audience Directory
Finally, the Followers tab is your direct line to your community. It shifts the focus from what is working to who you're connecting with. This is where you stop guessing and start building a real, data-backed picture of your audience.
Here, you’ll find essential demographic info, such as:
Gender: The breakdown of your audience.
Top Territories: The countries where your followers are tuning in from.
Follower Activity: A super-useful chart showing the exact hours and days your followers are most active on TikTok.
This information is pure gold. If you're curious about how this compares to other platforms, looking at a general guide to a social media analytics dashboard can offer some broader context. But for TikTok, knowing when your audience is online is your secret weapon for scheduling posts to get that crucial initial burst of engagement.
Decoding the Metrics That Drive Performance
Once you've found your way around the analytics dashboard, the real work begins: figuring out what all those numbers are trying to tell you. Your TikTok creator analytics are packed with data, but only a handful of metrics truly reveal how your videos are landing with your audience. Learning to read them is like learning to read your viewers' minds.
Think of every video you post as a mini-movie you've directed. Did the opening scene hook them? Did the story keep them glued to their screen until the credits rolled? These metrics are your audience's review.
The Most Important Video Metrics
Let's be clear: not all metrics are created equal. Likes and comments are nice for the ego, but the data that genuinely moves the needle for the TikTok algorithm is all about watch time. This is the ultimate signal to TikTok that your content is doing its job—keeping people on the app.
Here are the key performance indicators you need to obsess over:
Average Watch Time: This is the average number of seconds people stick around to watch your video. If you have a short average watch time, it’s a red flag that your hook isn't strong enough or the middle of your video is dragging. People are bailing early.
Watched Full Video %: This number tells you exactly what percentage of viewers made it to the very end. A high percentage here is a massive win. It tells the algorithm your content is satisfying from start to finish, which is a powerful signal for promotion.
Total Play Time: This is the grand total of all the time spent watching your video across all viewers. A huge total play time, even on a shorter clip, often means it's getting replayed over and over—a key ingredient for going viral.
This infographic gives you a visual breakdown of the audience demographics you’ll find, which is another huge piece of the puzzle. Who you're reaching directly impacts how they'll respond to your content.
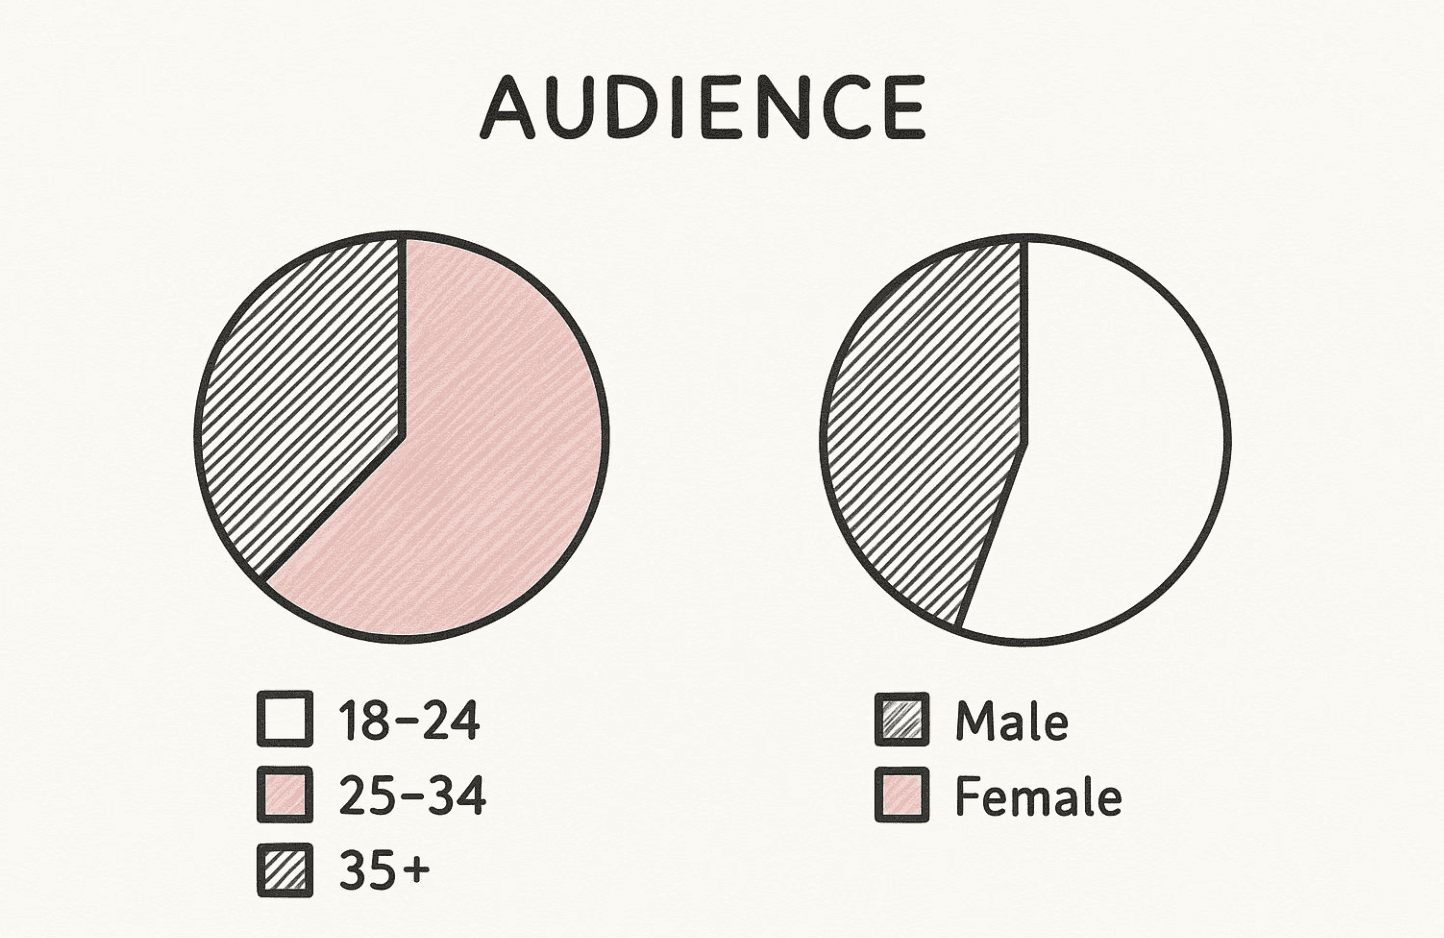
Seeing your audience composition laid out like this helps you connect the dots between who is watching and what they're watching, allowing you to fine-tune your topics and tone.
To help you put these numbers into action, here’s a quick-glance table breaking down the most critical metrics and what they mean for your content strategy.
Key Content Metrics and Your Strategic Response | ||
|---|---|---|
Metric | What It Measures | Strategic Question It Answers |
Average Watch Time | The average duration a viewer spends on your video before swiping away. | Is my video hook strong enough? Am I losing viewers' attention in the middle? |
Watched Full Video % | The percentage of viewers who watched your video from the beginning to the very end. | Is my content compelling enough to hold attention until the end? Does the payoff deliver on the hook's promise? |
Total Play Time | The cumulative, total time all viewers have spent watching your video. | Is this video so engaging or interesting that people are watching it multiple times? |
Likes, Comments, Shares | Direct engagement actions taken by viewers on your video. | Is my content sparking conversation and making people feel something? Is it valuable enough to share with others? |
For You Page Views | The number of views your video received from the main discovery feed. | Is my content appealing to a broad audience and being pushed by the TikTok algorithm? |
Profile Views | The number of views your video received from people who visited your profile first. | Am I building a loyal community that actively seeks out my content? |
Think of this table as your diagnostic tool. When you see a number you don't like, find the corresponding question to start figuring out why and what you need to fix.
Understanding Your Traffic Sources
Just as crucial as how long people watch is how they found you in the first place. The "Traffic source types" metric in your dashboard is your roadmap to discovery, showing you precisely where your views are coming from.
Your traffic source mix tells a story. A high "For You" percentage means the algorithm is pushing your content, while a high "Profile" percentage indicates you're building a loyal fanbase that actively seeks you out.
Here’s a breakdown of what each source means for your strategy:
For You: This is the big one. These are views from TikTok’s main discovery feed, and it's your primary engine for reaching new people and going viral. A high number here is a sign that your video is hitting all the right notes for a broad audience.
Profile: These views come from people who landed on your profile page and then decided to click on a video. This is a fantastic indicator of a loyal following and growing brand curiosity. They didn't just stumble upon you; they came looking.
Sound: When someone hears the audio you used on another video and taps it to see more clips with that sound, any view you get from that action lands here. This highlights just how powerful jumping on a trending audio can be for discovery.
Search: These are views from people who found your video after typing in a specific keyword or hashtag. This is where optimizing your video descriptions and hashtags really pays off.
By analyzing this mix, you can see how people are finding your content and double down on what's working. If you're ready to go even deeper, there are plenty of specialized TikTok analytics tools that provide insights far beyond the native dashboard. Getting a firm grip on these metrics is the first step toward building a content strategy that isn't just guesswork but a repeatable formula for growth.
Building a Clear Picture of Your Audience

Sure, video views are great, but the real gold in your TikTok creator analytics is understanding the people behind the screen—your community. The ‘Followers’ tab is where you turn raw data into a living, breathing audience persona. It's the difference between shouting into the void and having a real conversation.
This is where you finally stop making content for a faceless crowd and start speaking directly to your biggest fans. Once you get a handle on gender, top territories, and when your followers are actually online, you can start tailoring your content—your humor, your references, your style—to build a connection that actually sticks.
Interpreting Follower Demographics
Think of the demographic data in your dashboard as the foundation of your audience persona. It gives you two of the most critical puzzle pieces right away:
Gender: This is a straightforward breakdown of your followers' gender. Is your content hitting home with a specific group? That insight can immediately inform your tone and the topics you choose to tackle.
Top Territories: Here you’ll find the top countries where your audience lives. This is huge. It helps you understand cultural context, potential language barriers, and even what time of day your audience is awake and scrolling.
On a platform with such an insane scale, knowing who you're reaching is everything. TikTok’s growth has been mind-blowing. Back in January 2018, it had around 55 million monthly active users. By the end of last year, that number had exploded to 1.12 billion, and recent estimates push it as high as 1.59 billion. You can dive deeper into TikTok's incredible growth at BizReport.com.
Knowing your audience isn’t just about making better videos; it’s about building a community that feels seen and understood. Your analytics are the blueprint for that community.
Using Follower Activity for Perfect Timing
If I had to pick one tool from the Followers tab, it would be the Follower Activity graph. This is your golden ticket for scheduling. The chart literally shows you the exact hours and days your followers are most active on TikTok.
It's just like a TV network saving its biggest shows for prime time. If you can post your video an hour or two before your audience’s activity peaks, you give it a massive head start on engagement. That initial burst of likes and comments is a huge signal to the TikTok algorithm, often deciding whether your video gets a wider push on the For You page.
You can get even smarter by layering this data with your "Top Territories" info. Got a big chunk of followers in a completely different time zone? Try experimenting with posting times that hit their prime time, not just your own. This kind of strategic scheduling can unlock pockets of engagement you were totally missing before. For a deeper dive, check out our complete guide to using TikTok audience insights for growth.
Turning Analytics into Actionable Content Ideas
Alright, you’ve got the data. But just staring at graphs isn't what gets you more views. The real magic happens when you use those numbers to make better, smarter content.
Your TikTok creator analytics aren't just a report card on what you've done; they're a roadmap for what to do next. They’re packed with clues about what your audience—and the algorithm—truly wants from you. This is where we connect the dots between the numbers and your next viral video.
Think of yourself as a content detective. Every metric is a piece of the puzzle. A ton of views from the For You page? Great clue. That means your hook is solid. But if your "Watched Full Video" percentage is in the gutter, you're losing people somewhere. Your mission is to find out where, and why.
Diagnosing Your Content Performance
Let's walk through a few common scenarios you'll see in your analytics and what moves you should make. Each pattern is telling a story, and learning to read them is a superpower.
Scenario 1: The Strong Start, Weak Finish
The Data: Your views from the For You page are high, but your Average Watch Time is low. You look at the retention graph and see a nosedive after the first three seconds.
The Diagnosis: You did the hard part—you stopped the scroll! But the video didn't live up to the promise of that killer hook.
The Action: The middle of your video needs a shot of adrenaline. Think faster cuts, text overlays that pop, or a "pattern interrupt"—something totally unexpected that snaps the viewer back to attention. Don't let that initial interest fade.
Scenario 2: The Hidden Gem
The Data: A video has a pretty low view count, but the people who do watch it are obsessed. The Watched Full Video rate is sky-high, and it's getting a lot of shares.
The Diagnosis: You've struck gold with a niche audience. The content is fantastic, but it wasn't packaged in a way that screamed "watch me!" to the masses.
The Action: Double down on this format, immediately. Remake the video, but this time, slap a trendier sound on it or use a more curiosity-driven hook. You've already proven the concept works; now give it the viral packaging it deserves.
Your best videos are never a fluke. They are direct feedback from your audience, telling you precisely what to make next. Break them down. What was the topic? The format? The sound? Replicate that winning formula.
Pinpointing the Exact Moment You Lose Them
Your video retention graph is one of the most powerful tools you have. It literally shows you, second by second, when people get bored and swipe away. Don't just glance at it—study it.
If you notice a huge drop-off at the 5-second mark across a bunch of videos, that's your sign. Your intros are too slow. Get to the point faster. If everyone is leaving right before you drop your call-to-action, maybe you need to ask for the follow or comment a little earlier. Perform a content autopsy with this graph and find the weak spots.
Let Your Audience Data Guide Your Strategy
The "Followers" tab is another goldmine of strategic insights. When you mix your audience demographics with your content performance, you get a crystal-clear creative direction.
For instance, let's say your analytics show that your most engaged fans are women aged 25-34 in the United States, and your top-performing videos are all quick tutorials. You've just been handed a roadmap. This audience clearly values efficient, actionable tips. So lean into it! Create more content that solves their problems in under 30 seconds.
The same goes for sounds and trends. If your followers are consistently interacting with a certain type of audio, that's a massive hint. Your analytics are a direct line to your audience's brain. Use them not just to measure your past, but to build a much more successful future.
Common Questions About TikTok Analytics
Diving into your TikTok creator analytics is exciting, but it can also raise a few practical questions. Even when you feel like you've got a handle on the dashboard, some common points of confusion pop up for just about every creator.
Let's clear the air. Here are some direct, no-fluff answers to the questions we hear the most, so you can start interpreting your data with total confidence.
How Long Does It Take for TikTok Analytics to Update?
One of the first things creators notice is the data lag. If you post a video and immediately rush to check its stats, you're going to be disappointed. TikTok analytics don't update in real-time.
It usually takes anywhere from 24 to 72 hours for all the numbers to fully process and show up in your dashboard. For a reliable first look at how a new video is doing, your best bet is to wait at least a full day. And remember, the data for older videos will keep changing as they pick up more views over time.
Why Can I Not See Analytics for a Specific Video?
Staring at a blank analytics page for one of your videos? There are usually two simple reasons for this. The first, and most common, is that you're on the wrong type of account. You have to have a Creator or Business account to get analytics; personal accounts just don't have this feature.
The second reason is that analytics only kick in for videos you post after you’ve made the switch to a Creator or Business profile. Any content you uploaded back when your account was set to "Personal" won't have any performance data, even after you upgrade.
A word of caution: avoid switching back and forth between account types. If you flip back to a personal account, you'll lose access to all your past analytics data. Switching to a Creator account again means you'll start collecting new data from scratch.
What Is a Good Average Watch Time on TikTok?
This is the golden question. While TikTok doesn't give an official "good" number, the creator community has figured out some solid benchmarks. A good starting goal is to hit an average watch time of at least 50-60% of your video's total length. Hitting this target is a strong signal to the algorithm that your content is doing its job and holding people's attention.
But if you want a real shot at going viral, you need to aim higher. Many top creators will tell you that getting a completion rate close to 100%—or even getting people to re-watch—is the true secret sauce. So, instead of just chasing a "good" percentage, obsess over your video's retention from the first second to the last. The goal is to keep viewers so hooked they can't look away.
Unlock the patterns behind viral content and grow faster with Virlo. Our platform analyzes millions of posts daily to surface the trends, sounds, and content formats that are actually working, turning hours of research into minutes of actionable insight. Start making data-driven decisions and find your next viral hit at https://virlo.ai.
See What's Trending Right Now
- Social listening for TikTok, Reels & Shorts
- Spot viral trends before they peak
- Turn insights into ads, scripts & briefs
The Signal Newsletter
Weekly trend breakdowns, creator insights, and social listening tips — straight to your inbox.
Subscribe FreeSee What's Trending Right Now
- Social listening for TikTok, Reels & Shorts
- Spot viral trends before they peak
- Turn insights into ads, scripts & briefs
The Signal Newsletter
Weekly trend breakdowns, creator insights, and social listening tips — straight to your inbox.
Subscribe FreeRelated Articles

What Content Makes the Most Money on TikTok in 2026? (By Niche)
Niche-by-niche breakdown of TikTok creator earnings in 2026: Creator Fund payouts ($0.02–$0.15 CPM by niche), brand deal rates ($150–$5,000 per 100K followers depending on category), TikTok Shop affiliate commissions, and how to pick a profitable niche.
Tiktok Shop vs Amazon: What is the Difference?
Tiktok Shop vs Amazon: What is the Difference? Compare conversion, fees & operations to pick the best channel. Virlo’s tool delivers data-backed insights.

Instagram Post Ideas: 2026 Guide With Real Examples
Stuck on what to post? These Instagram post ideas are pulled from real videos getting outsized views in 2026 - across every niche, every account size.
Get The Signal
Join creators, marketers, and agencies getting weekly trend breakdowns and social listening insights delivered free.
Subscribe to the Newsletter
Stop Guessing. Start Knowing.
Join thousands of digital entrepreneurs using data to take the guesswork out of capitalizing on trends.